Building a Reporting System That Scales Across Clients.
I designed a reusable, 10-page Looker Studio dashboard that became the standard PPC reporting framework at Digital Canvas Marketing. Built to make campaign performance easier for clients to understand, the system provided a consistent way to communicate results, demonstrate the value of ongoing marketing efforts, and support stronger client relationships as the agency grew.
Results explorer
One healthcare account, monthly Looker Studio reports
Jan → Mar 2026
- Jan 2026
- 19
- Feb 2026
- 25
- Mar 2026
- 23
- Jan 2026
- $58.06
- Feb 2026
- $40.00
- Mar 2026
- $47.80
February, the strongest month, in navy · Source: monthly Looker Studio reports
Context
The Context & Objective
Managing PPC accounts across multiple clients meant regularly communicating campaign performance to business owners who weren't necessarily familiar with Google Ads or marketing analytics. While the platform provided detailed performance data, clients needed a clearer way to understand how their advertising budgets were being spent, what results they were generating, and how performance was changing over time.
As the agency supported more accounts, the goal was to develop a standardized, reusable reporting system that made campaign results easier for clients to understand while improving the efficiency of the reporting process. By giving clients a clear monthly performance overview and the option to schedule a call when needed, the system could support greater transparency, client satisfaction, and retention while reducing the need for routine reporting meetings.
The report
What the Report Covers
Overview
Monthly snapshot with day-by-day trends against the previous month.
Account
Clicks, CTR, cost, conversions, and conversion rate in one table.
Campaign
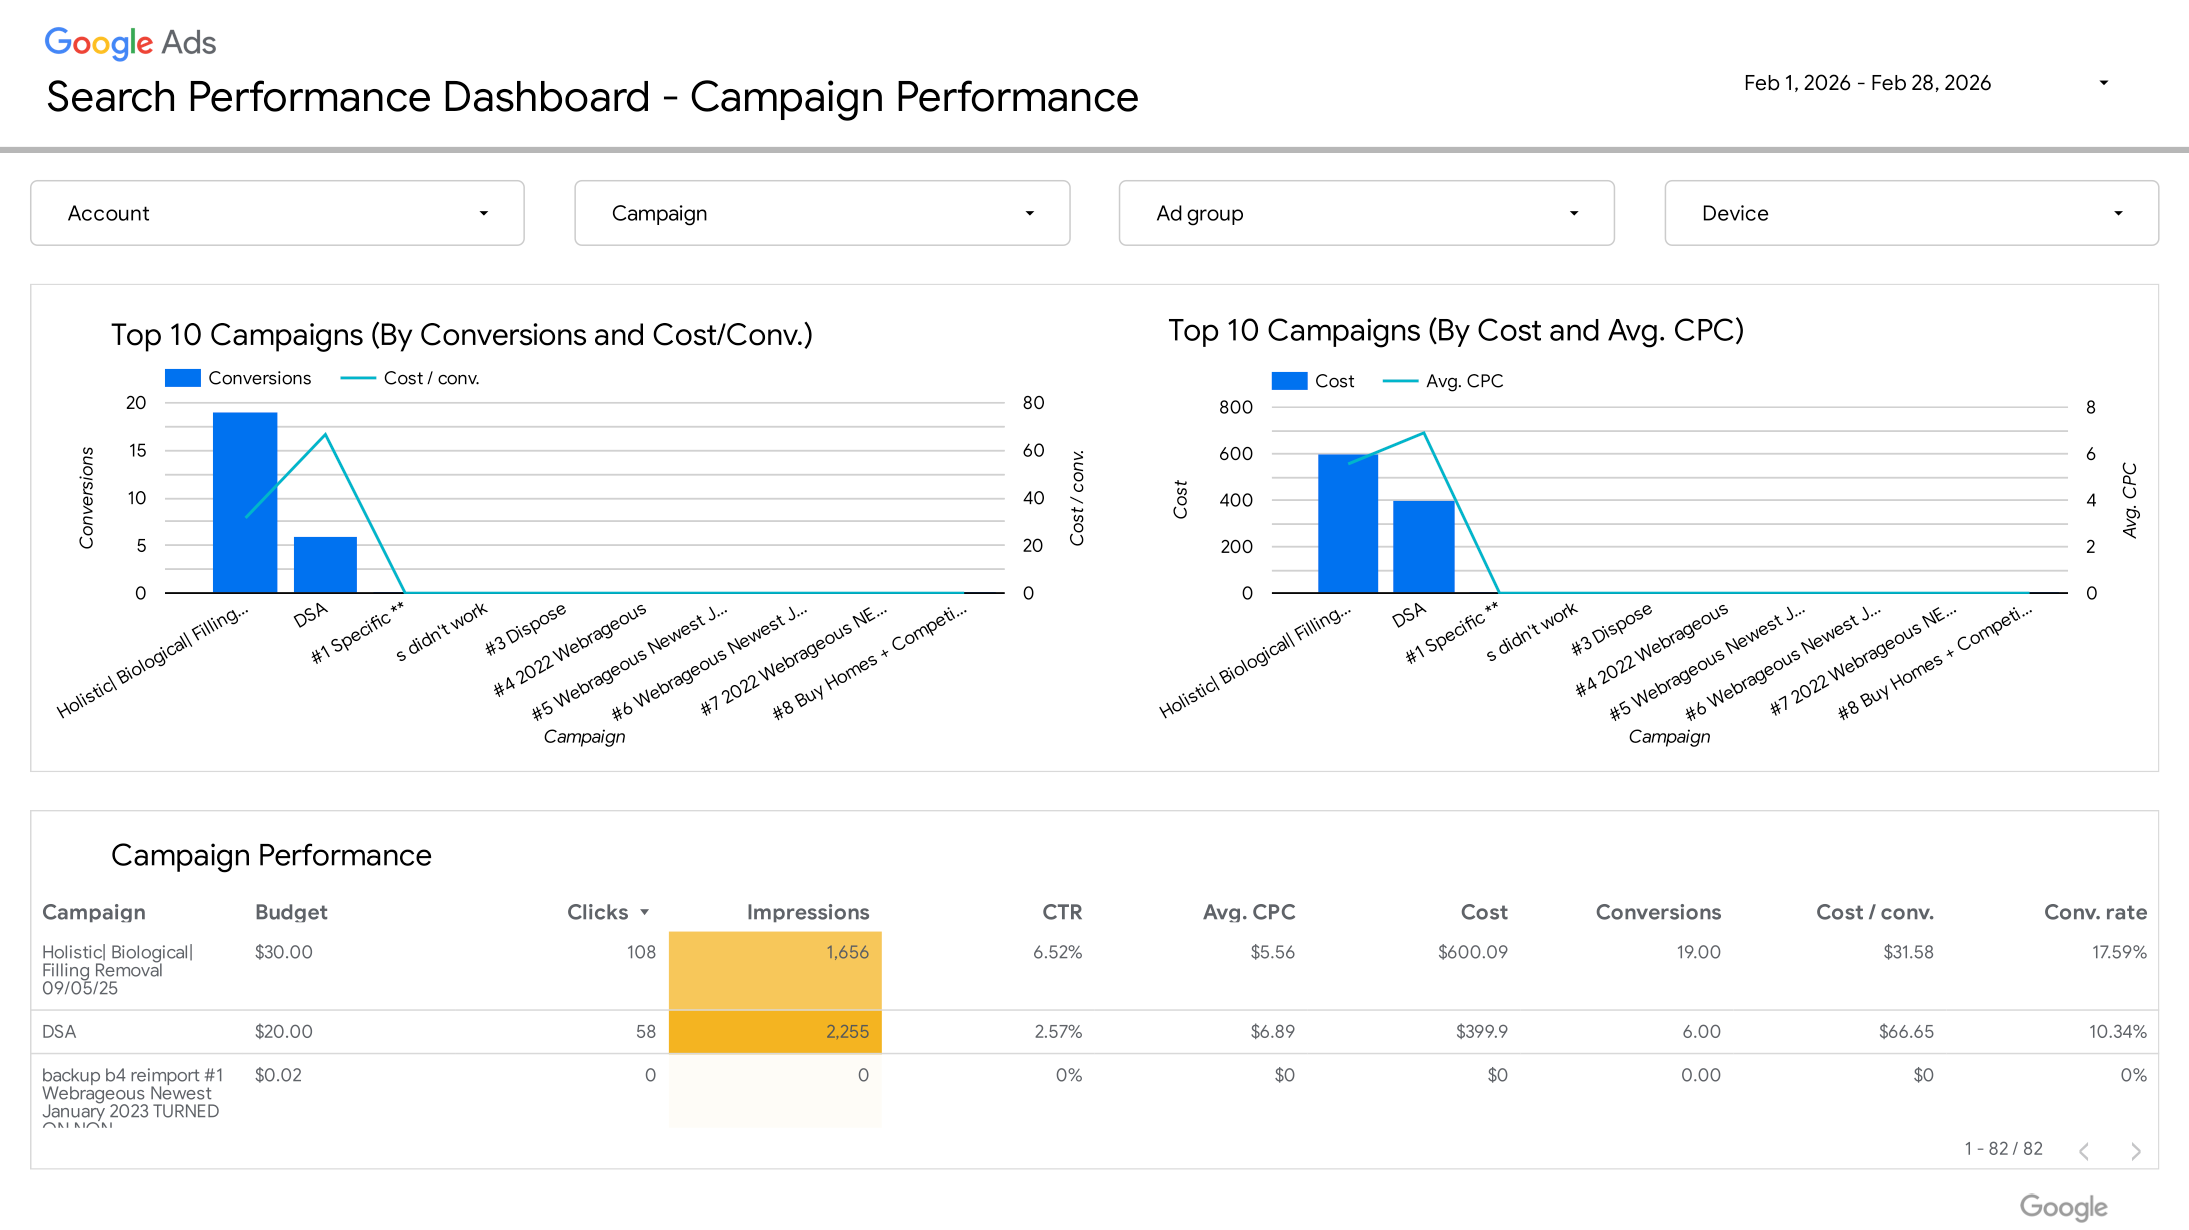
Top campaigns ranked by conversions, cost per conversion, and spend.
Ad Group
Ad group and ad-type performance to identify which messages convert.
Keyword
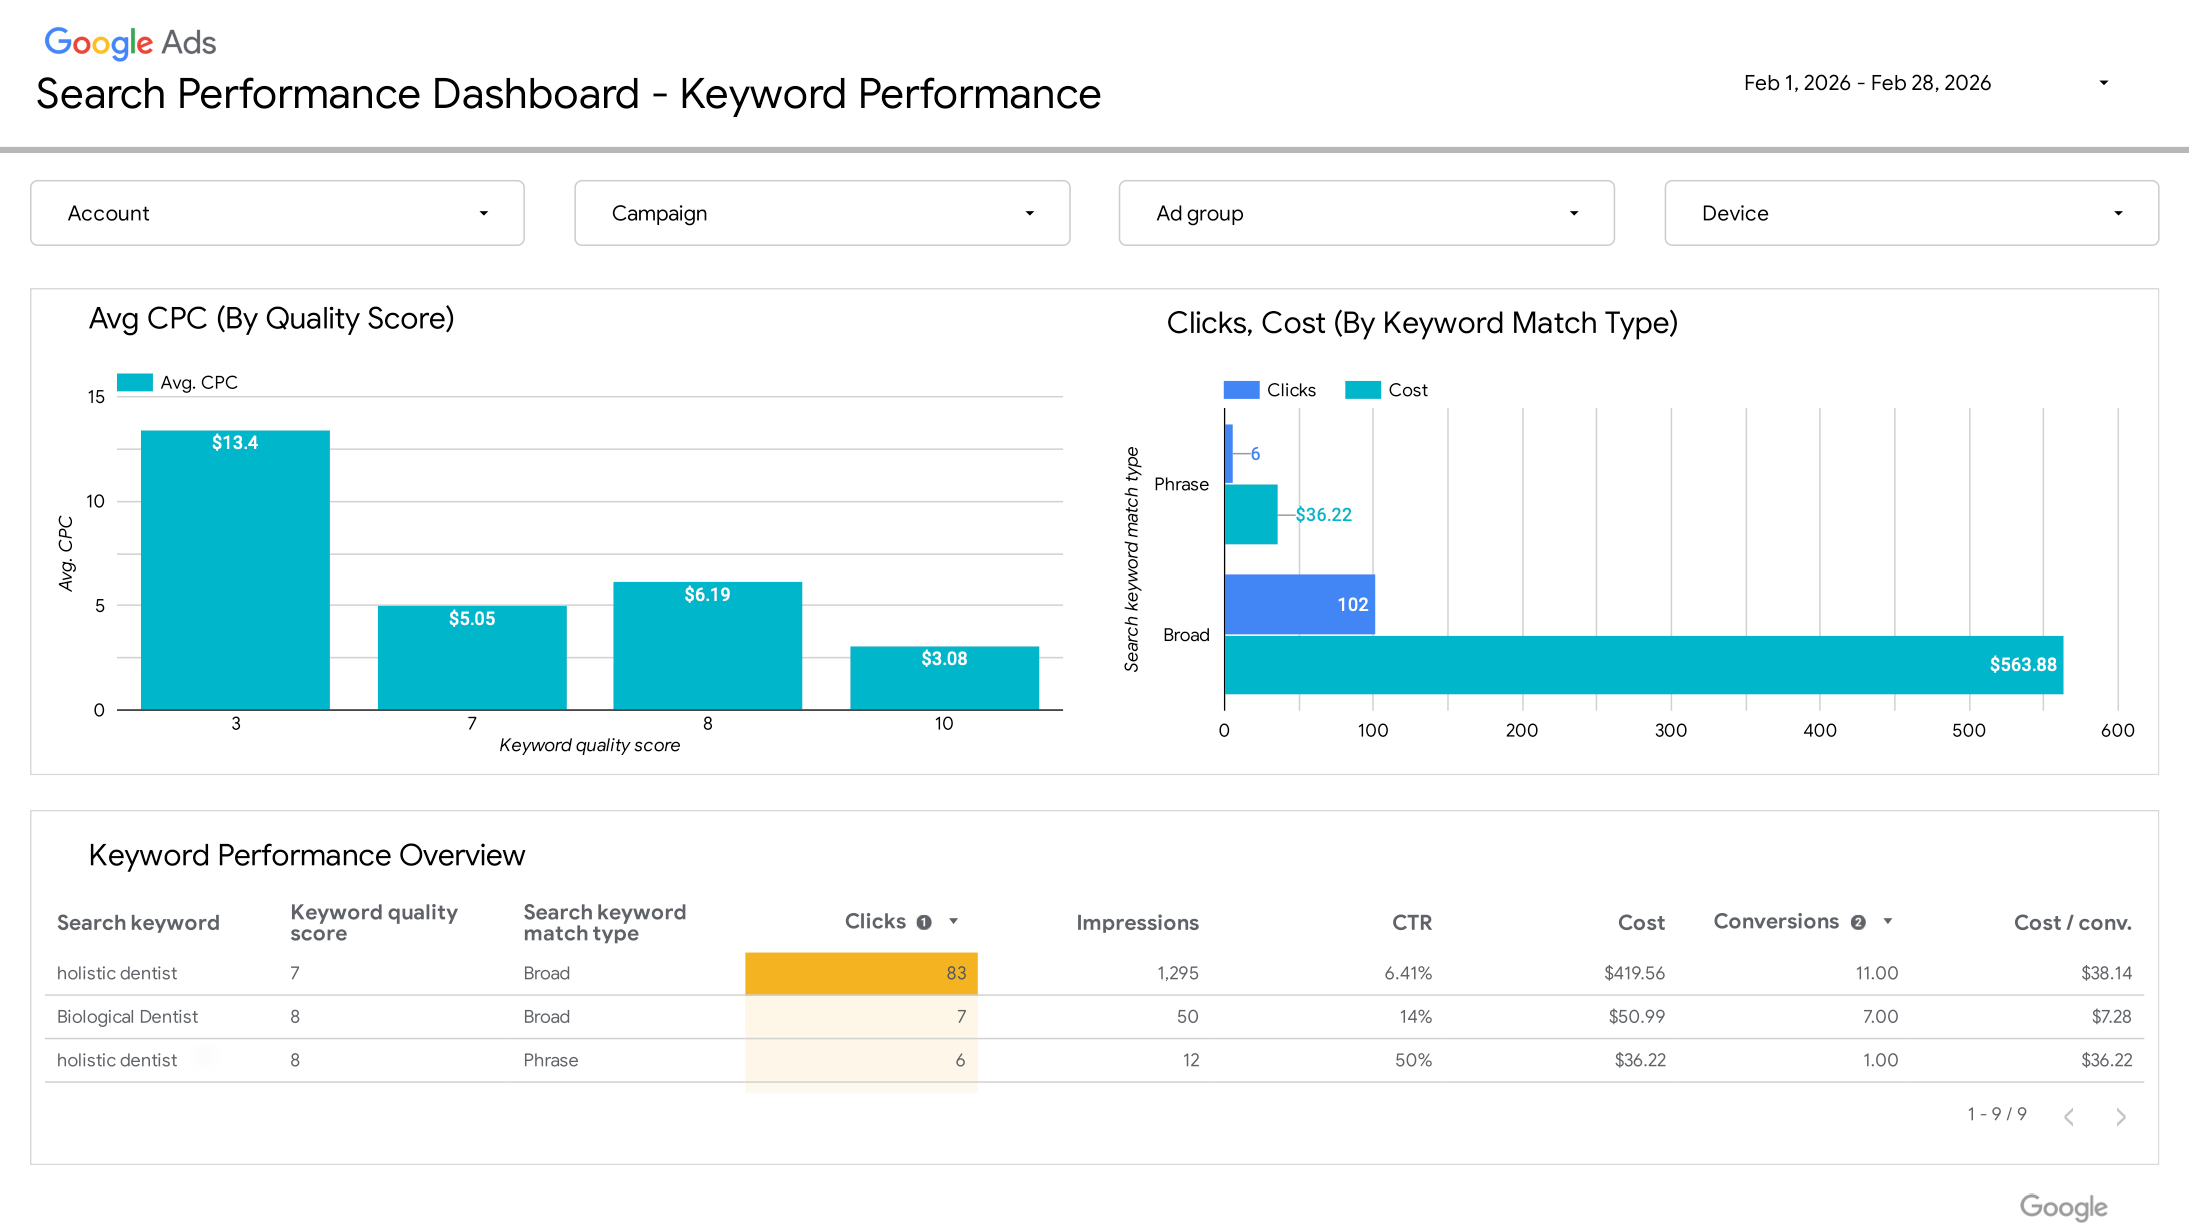
Quality Score, match type, and cost per conversion by keyword.
Search Query
Actual searches triggering ads, useful for identifying negative and new keywords.
Device
Mobile versus desktop conversions and costs.
Demographic and Geographic
Conversion patterns by age, gender, and location.
Over time
Three Months in One Account
A consistent reporting framework made it easier for clients to follow performance over time, understand monthly changes, and see how their advertising investment was performing beyond a single reporting period.
| Metric | January 2026 | February 2026 | March 2026 |
|---|---|---|---|
| Conversions | 19 | 25 | 23 |
| Cost / conversion | $58.06 | $40.00 | $47.80 |
| Conversion rate | 12.58% | 15.06% | 14.02% |
| Ad spend | $1,103 | $1,000 | $1,099 |
February was the strongest month, generating 32% more conversions at a 31% lower cost per conversion than January, despite lower spending. While performance moderated in March, the account remained more efficient than in January. Presenting all three months provided a more complete picture of performance, including both improvements and fluctuations.
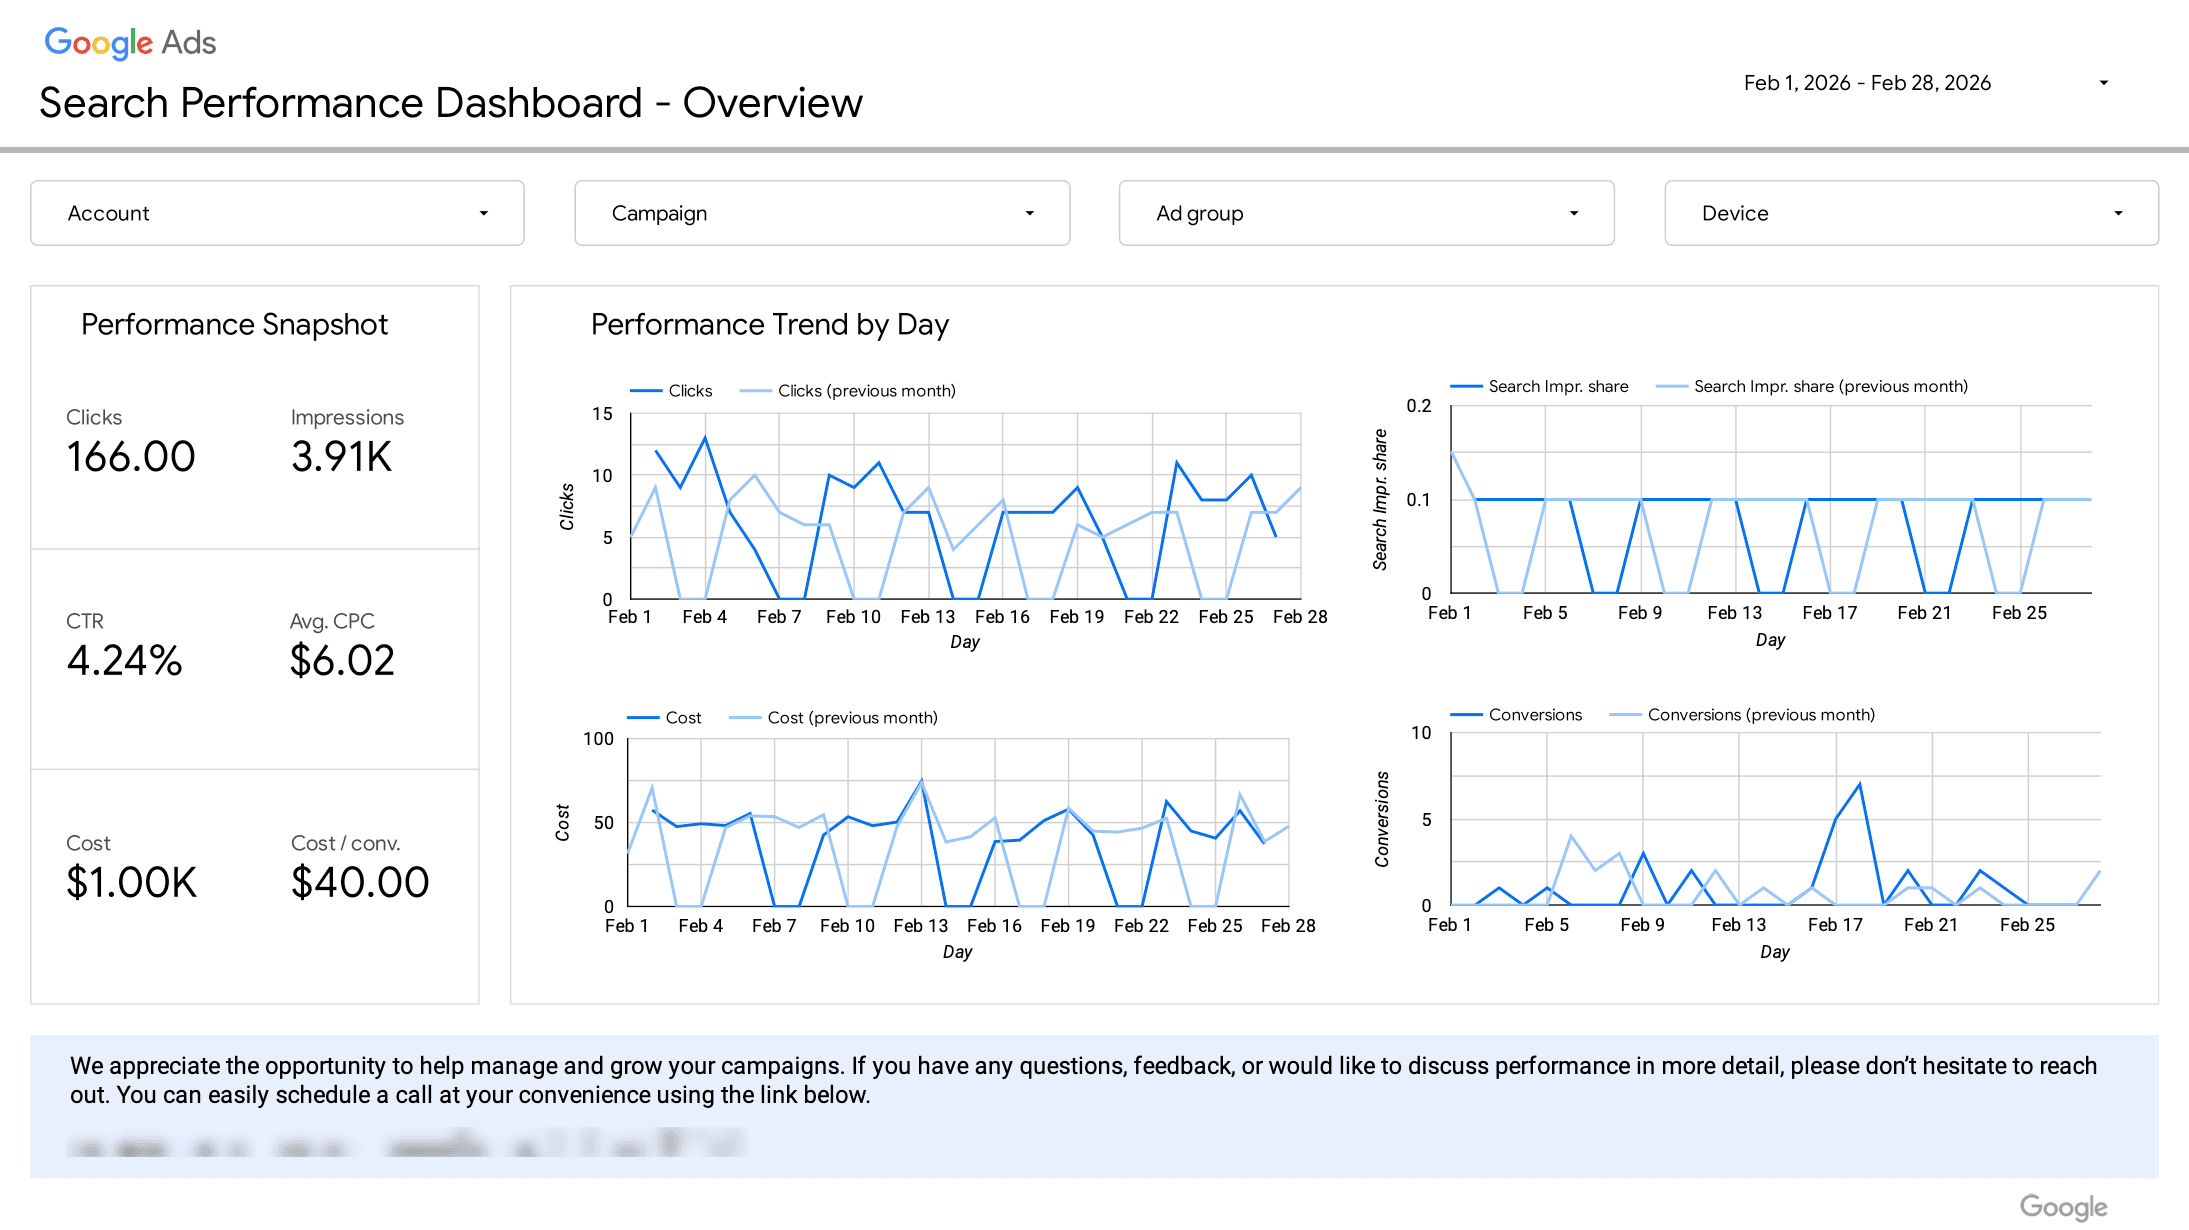
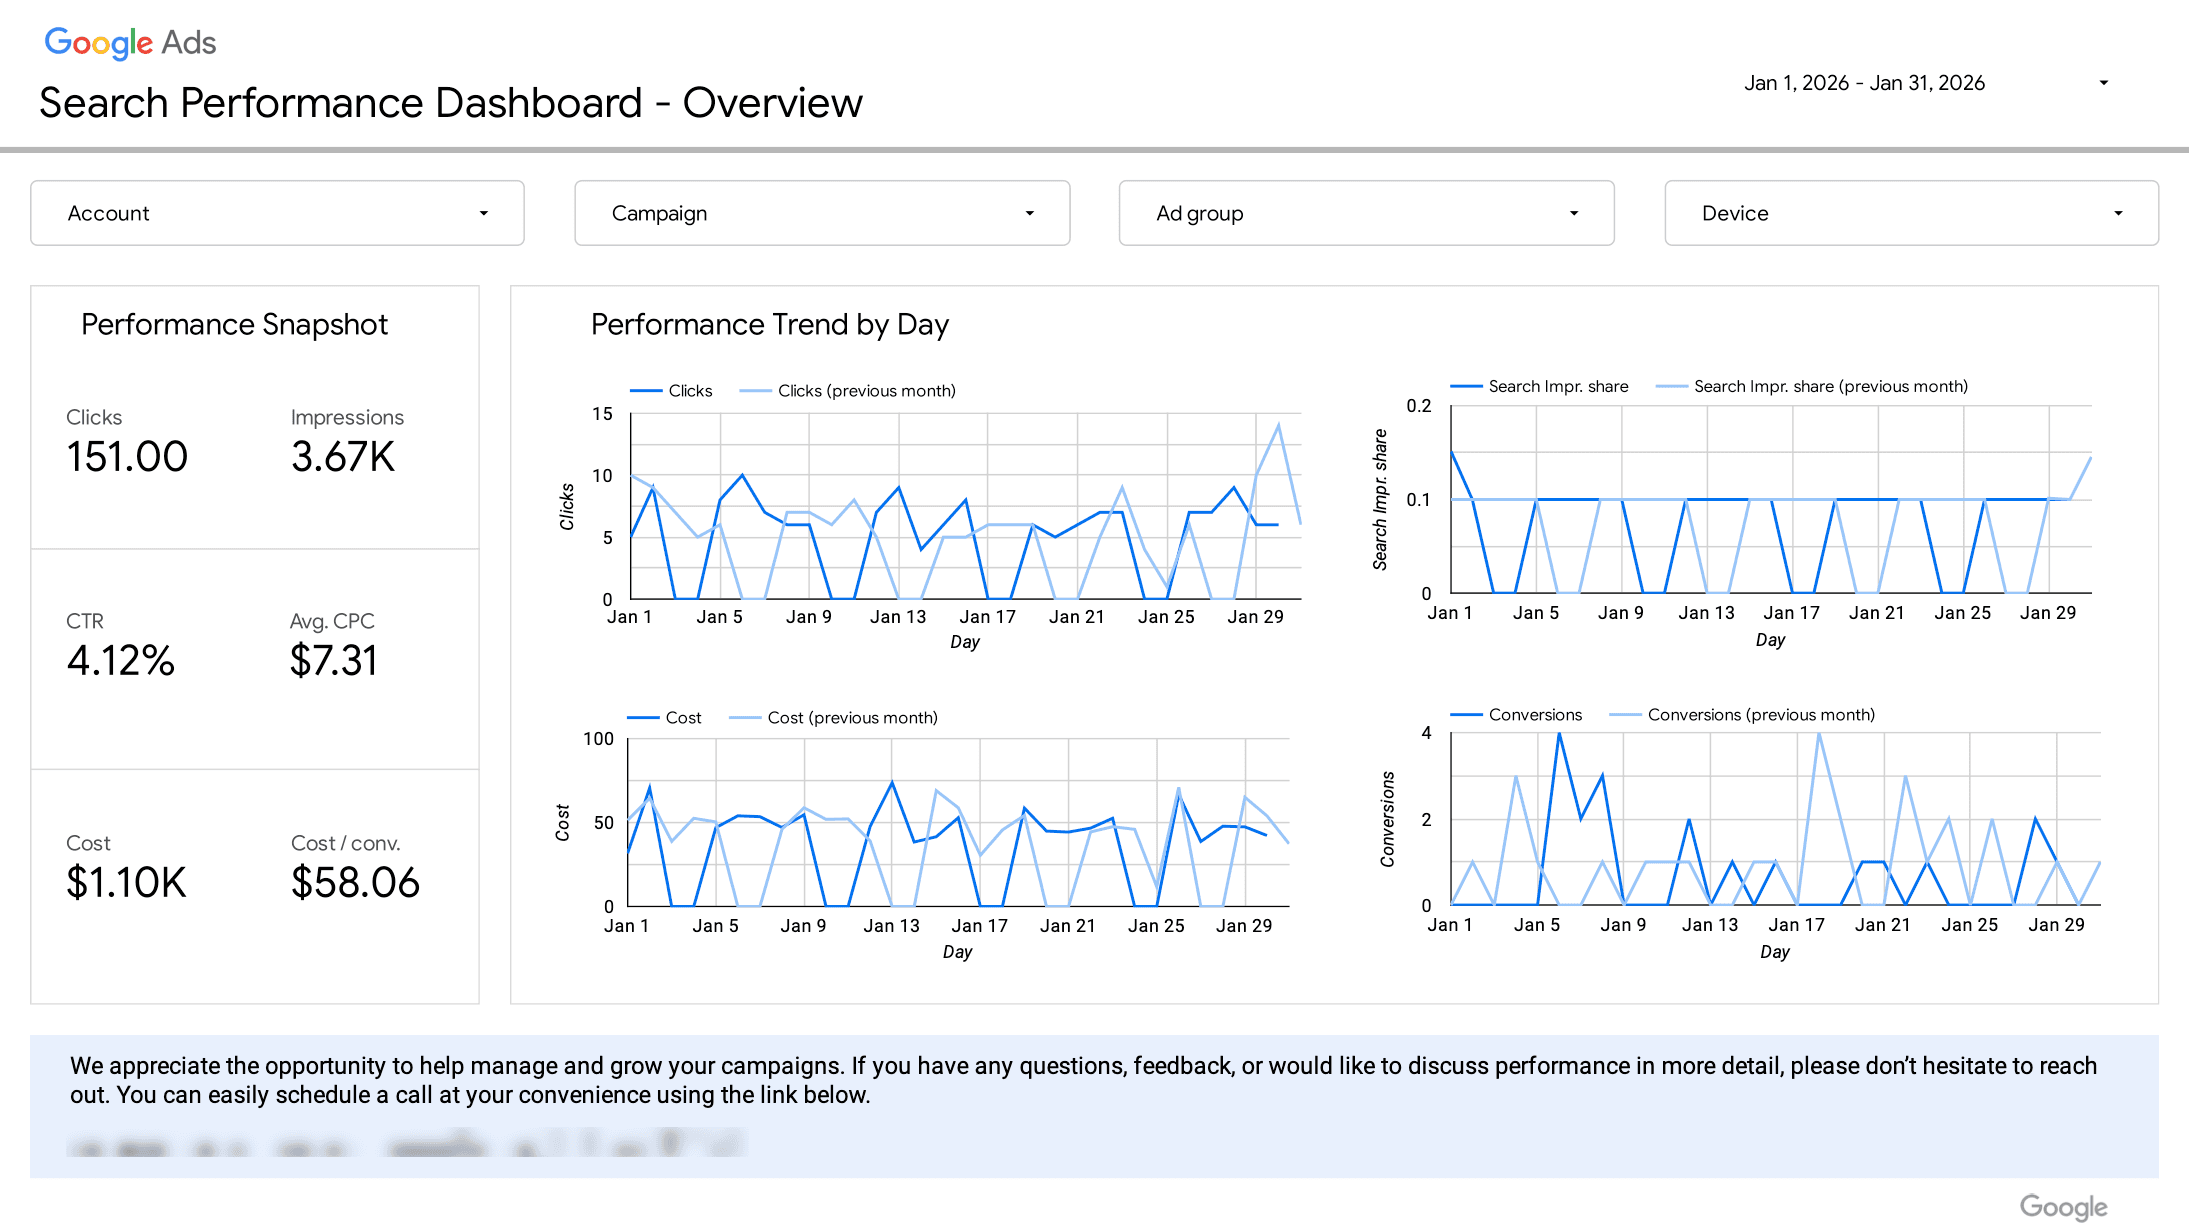
February in detail
A Closer Look at February
February's report also provided a more detailed view of where results were coming from. Breaking performance down by campaign, keyword, and device helped communicate which parts of the account were contributing most to the month's conversions.
Campaign Performance
The specialty campaign generated conversions at $31.58 each, compared with $66.65 for the Dynamic Search Ads campaign.
Keyword Performance
One core keyword generated 11 of the month's 25 conversions, while a lower-volume keyword produced 7 conversions at just $7.28 each.
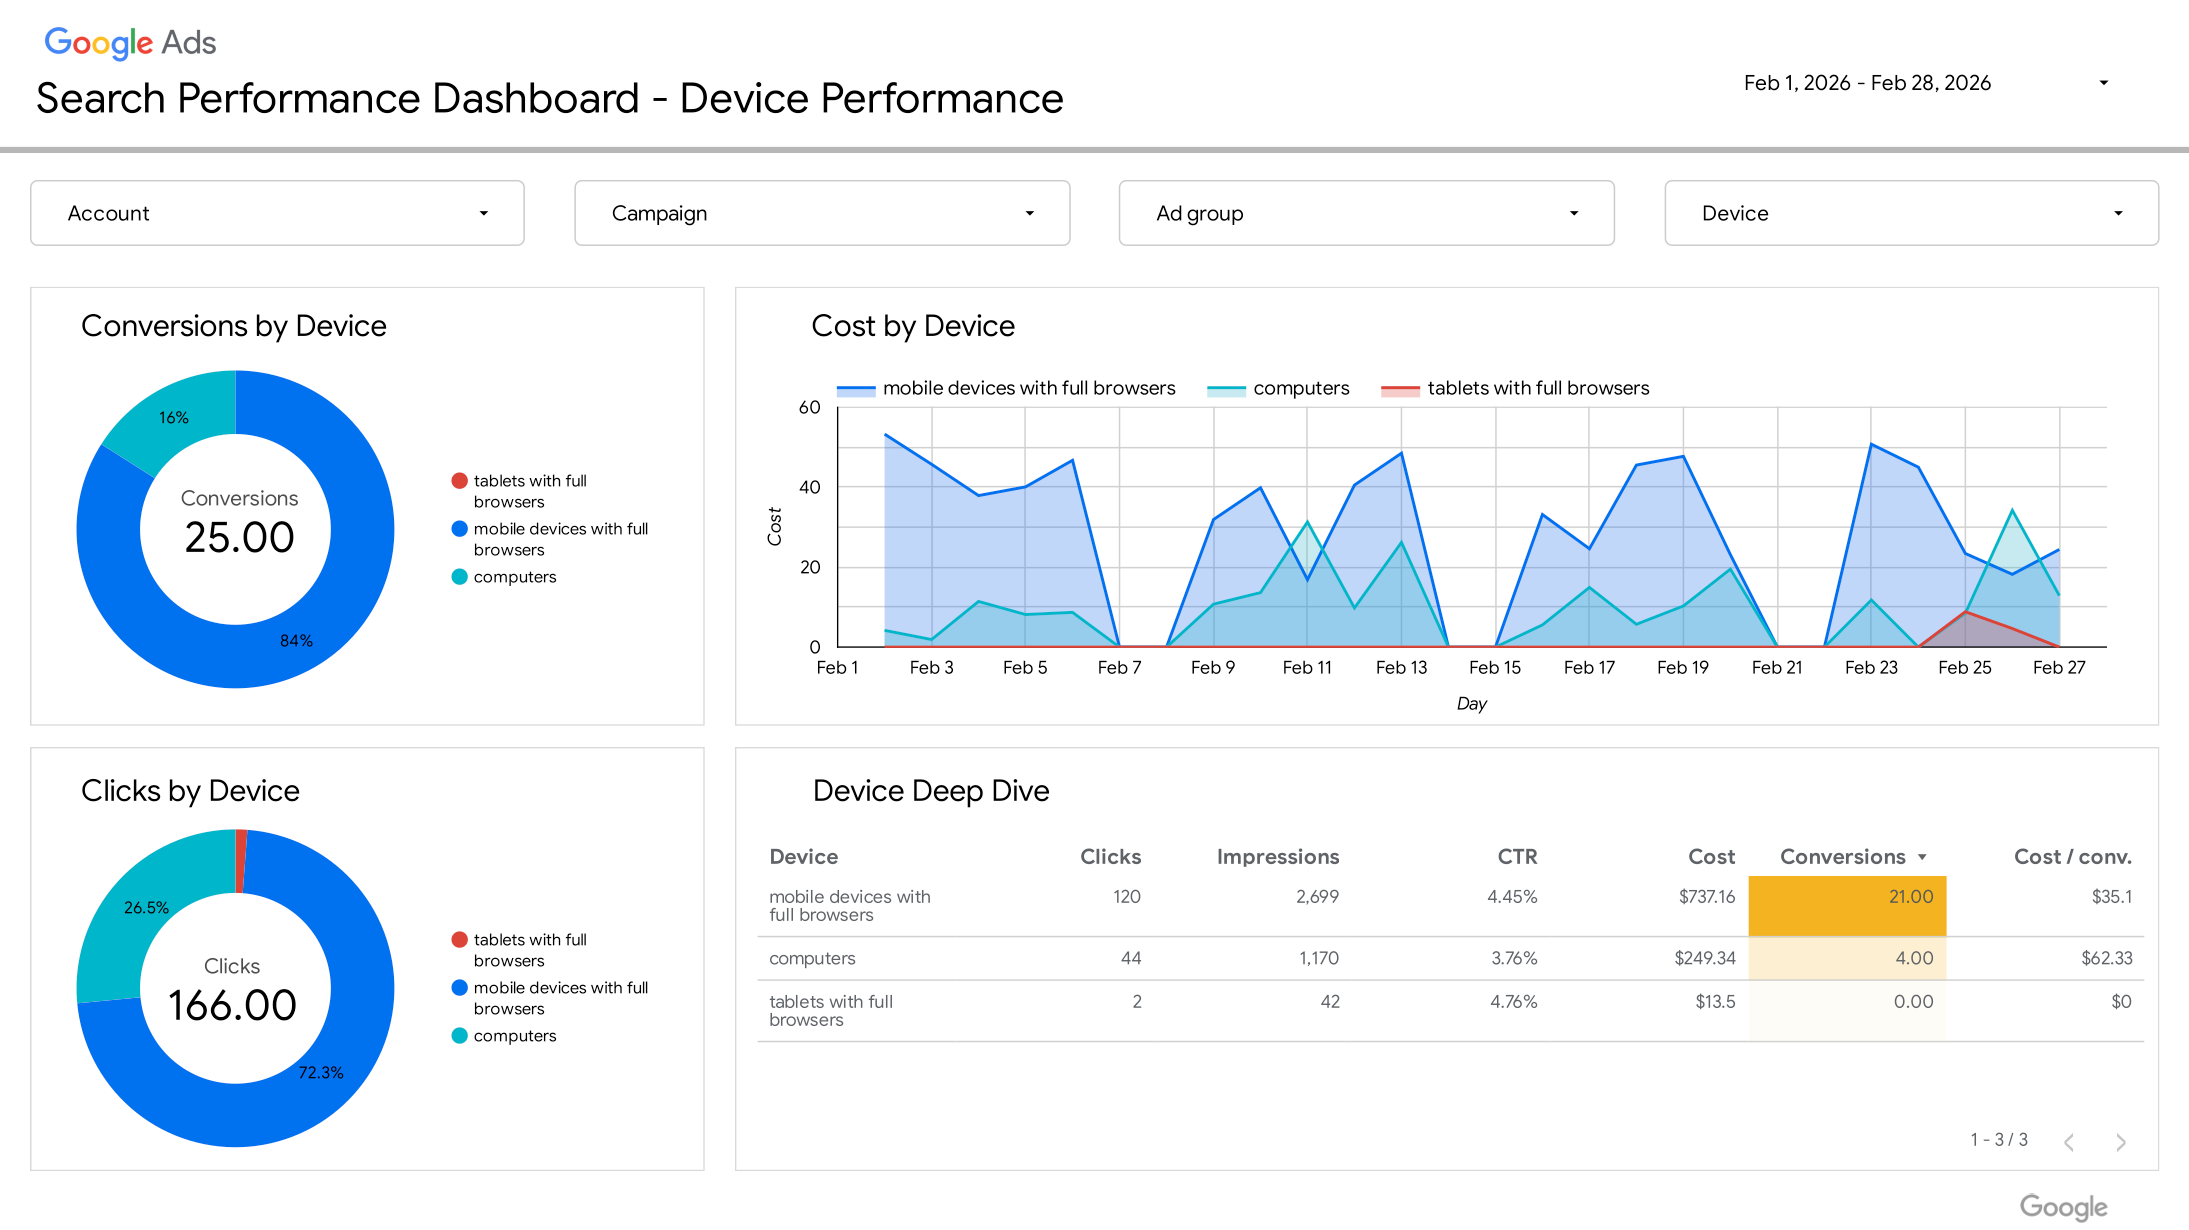
Device Performance
Mobile devices accounted for 84% of the account's conversions, highlighting the importance of understanding how customers interact with ads across devices.
Measurement
Reading the Data Honestly
A reporting dashboard is only as reliable as the data behind it. I made it a priority to verify that conversion tracking accurately reflected meaningful actions, such as phone calls, form submissions, and appointment requests, while recognizing that these actions don't necessarily translate into acquired customers.
Clear reporting also means acknowledging fluctuations, tracking limitations, and the difference between generating leads and producing business outcomes. The goal was to give clients an accurate understanding of campaign performance, not simply present the most favorable numbers.
Lessons
What I Learned
Build Once. Scale Across Clients.
A reusable reporting framework creates consistency across accounts and makes setting up reporting for new clients more efficient, without rebuilding dashboards from scratch.
Clarity Builds Client Confidence.
Clients don't need every technical detail. They need to understand what their investment is producing, how performance is changing, and where they can ask questions when needed.
Transparency Matters More Than Perfect Numbers.
Honest reporting means highlighting both progress and areas for improvement. Even during underperforming months, clear explanations and a plan for moving forward can help maintain client trust. Avoiding difficult conversations or presenting only favorable results can undermine that confidence.
A conversion is whatever the account counted as a lead (calls, forms, bookings). Month-over-month changes reflect results under my management, not a controlled experiment. Client names are withheld.